SozoRock Outlook · October 2026
Access, Capacity and Trust
The US economy is still growing, but hiring has slowed and prices and borrowing costs are higher. Institutions face distinct pressures in health access, workforce capacity, and AI. Workers at smaller firms pay the most toward family coverage, digital occupations have different growth prospects, and employee AI use is advancing faster than reports of clear organizational plans. This outlook examines the national data and the choices that will shape affordability, employment, and accountable services over the next year.
Free PDF with email verification.
Growth gives an incomplete account of the conditions facing households and institutions. Real GDP grew at a 2.2 percent annualized rate in the second quarter of 2026, and real final sales to private domestic purchasers, the combined measure of consumer spending and private fixed investment, grew 4.6 percent. Other indicators are less settled. Employers added 29,000 jobs in September, and the unemployment rate was little changed at 4.2 percent. Consumer prices were 3.7 percent higher than a year earlier, or 2.6 percent excluding food and energy, and the Federal Reserve raised its policy rate range to 3.75 to 4 percent in September. Demand is holding while hiring slows and borrowing costs rise. That sharpens three choices: who pays for care, which digital skills employers need, and how AI-supported decisions are governed.
Sources: US Bureau of Economic Analysis; US Bureau of Labor Statistics (The Employment Situation, Consumer Price Index); Board of Governors of the Federal Reserve System.
Health access depends on both coverage and household cost
In the Federal Reserve's 2025 household survey, cost-related missed care affected 38 percent of adults with family income below $25,000, compared with 13 percent at $100,000 or more. Almost one-quarter of insured adults also reported skipping treatment because of cost. Coverage and affordability require separate attention.
KFF's 2026 employer survey puts average annual worker contributions for family coverage at $9,687 in smaller firms (10 to 199 employees) and $6,840 in larger firms (200 or more). The difference reflects how the premium is divided as well as its total price: larger firms carry higher total premiums but pay a greater share themselves. For 2027 renewals, the question is whether benefit changes reduce the combined household bill while preserving access to essential providers.
Sources: Board of Governors of the Federal Reserve System; KFF.
Exhibit 1
Workers at smaller firms pay $2,847 more toward family premiums.
Average annual contribution for covered workers with family coverage, 2026, US dollars
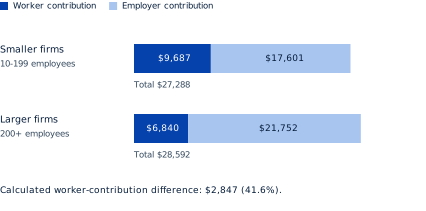
Employer contributions are calculated as total premium minus worker contribution. Estimates describe covered workers, not all employees. Survey: 1,937 nonfederal public and private employers with 10+ workers, fielded January-July 2026; overall response rate 11%.
Source: KFF.
The SozoRock FoundationExhibit 3 in the full report
View exhibit data
| Category | Firm size | Worker contribution ($) | Total premium ($) |
|---|---|---|---|
| Smaller firms | 10-199 employees | 9,687 | 27,288 |
| Larger firms | 200+ employees | 6,840 | 28,592 |
Digital jobs require more selective workforce investment
Bureau of Labor Statistics projections for 2025-35 put information security analyst employment growth at 21 percent, compared with an 8 percent increase for computer network architects and a 4 percent decline for network and computer systems administrators. These are long-term projections, not current vacancies.
Replacement demand changes the interpretation. Systems administration still has 13,400 projected annual openings. Training therefore needs to distinguish growth, replacement hiring, and changes in the tasks people perform. Over the next year, paid placements and retention will provide a more direct test of a program's value than enrollment alone.
Sources: US Bureau of Labor Statistics (Information Security Analysts, Computer Network Architects, Network and Computer Systems Administrators).
Exhibit 2
Security has stronger projected growth; other roles still have openings.
US employment projections, 2025-35: total percentage change and average annual openings
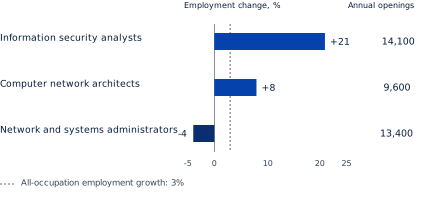
BLS ten-year projections, not current vacancies or a forecast for the next twelve months. Growth percentages are rounded. Annual openings include occupational transfers and labor-force exits. All occupations: 3% projected employment growth.
Sources: US Bureau of Labor Statistics (Information Security Analysts, Computer Network Architects, Network and Computer Systems Administrators).
The SozoRock FoundationExhibit 4 in the full report
View exhibit data
| Category | Projected employment change (%) | Average annual openings |
|---|---|---|
| Information security analysts | 21 | 14,100 |
| Computer network architects | 8 | 9,600 |
| Network and systems administrators | -4 | 13,400 |
AI use and institutional readiness are different measures
Gallup's August 2026 data show 53 percent of US employees using AI at least a few times a year, while 26 percent report that their organization has communicated a clear integration plan. The figures come from different questions; their difference is not a count of users working without a plan.
A separate Pew Research Center survey found 52 percent of US adults more concerned than excited about AI. Expanding use therefore leaves institutions with work to do: define permitted tasks, assign responsibility for decisions, and provide a usable route to correct mistakes. Performance and accountability need to advance together.
Sources: Gallup; Pew Research Center.
Exhibit 3
Employee AI use has grown faster than reports of a clear AI plan.
US employees reporting each measure, %
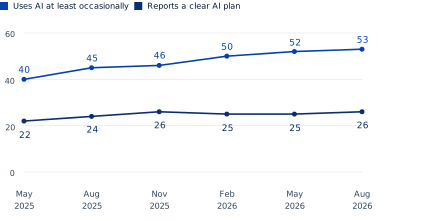
Use means at least a few times a year. Plan means employees report their organization communicated a clear AI integration plan. Separate questions, not mutually exclusive groups. Weighted Gallup Panel surveys of US employees aged 18+; month labels follow the source's tables.
Source: Gallup.
The SozoRock FoundationExhibit 5 in the full report
View exhibit data
| Survey month | Uses AI at least occasionally (%) | Reports a clear organizational AI plan (%) |
|---|---|---|
| May 2025 | 40 | 22 |
| Aug 2025 | 45 | 24 |
| Nov 2025 | 46 | 26 |
| Feb 2026 | 50 | 25 |
| May 2026 | 52 | 25 |
| Aug 2026 | 53 | 26 |
The outlook through October 2027
The next six to twelve months will test three institutional choices: how employers distribute higher benefit costs, whether training connects people to specific jobs, and whether AI-supported services become more accountable. Improvement would appear in lower cost-related missed care, sustained employment after training, and fewer unresolved service errors. Rising spending or adoption without those results would signal an unfinished transition.
Release dates to watch, as published or expected by each source:
- Third-quarter GDP, advance estimateOctober 29, 2026 · US Bureau of Economic Analysis
- Employment and unemploymentMonthly, first Friday in most months · US Bureau of Labor Statistics
- Employee AI use and organizational plansQuarterly; next reading expected November 2026 · Gallup
- Cost-related missed careExpected May 2027, covering 2026 · Board of Governors of the Federal Reserve System
- Employer premiums and worker contributionsExpected October 2027 · KFF
- Ten-year occupational projectionsExpected September 2027 · US Bureau of Labor Statistics
The full outlook
Nine pages. Six exhibits. Three institutional choices.
Read the national data, interpretation, and conditions to watch over the next year.
Download the free reportAbout this analysis
This is original analysis of published statistics and surveys, not an original SozoRock survey. Data were checked on October 27, 2026. Sources describe different populations and periods; estimates are not pooled. The report distinguishes observed conditions, ten-year labor projections, and conditional scenarios for the coming year.
About the author
Dr. Oluwabiyi Adeyemo is Director of Strategic Initiatives at The SozoRock Foundation, where he leads the Foundation's research and its Workforce Capacity and AI & Society programs.
Cite this outlook
Adeyemo, O. (2026). SozoRock Outlook: Access, Capacity and Trust, October 2026. The SozoRock Foundation, Inc.